> ## Documentation Index
> Fetch the complete documentation index at: https://docs.lumalytics.app/llms.txt
> Use this file to discover all available pages before exploring further.
# Dashboard
> General stats about your events.
## Overview
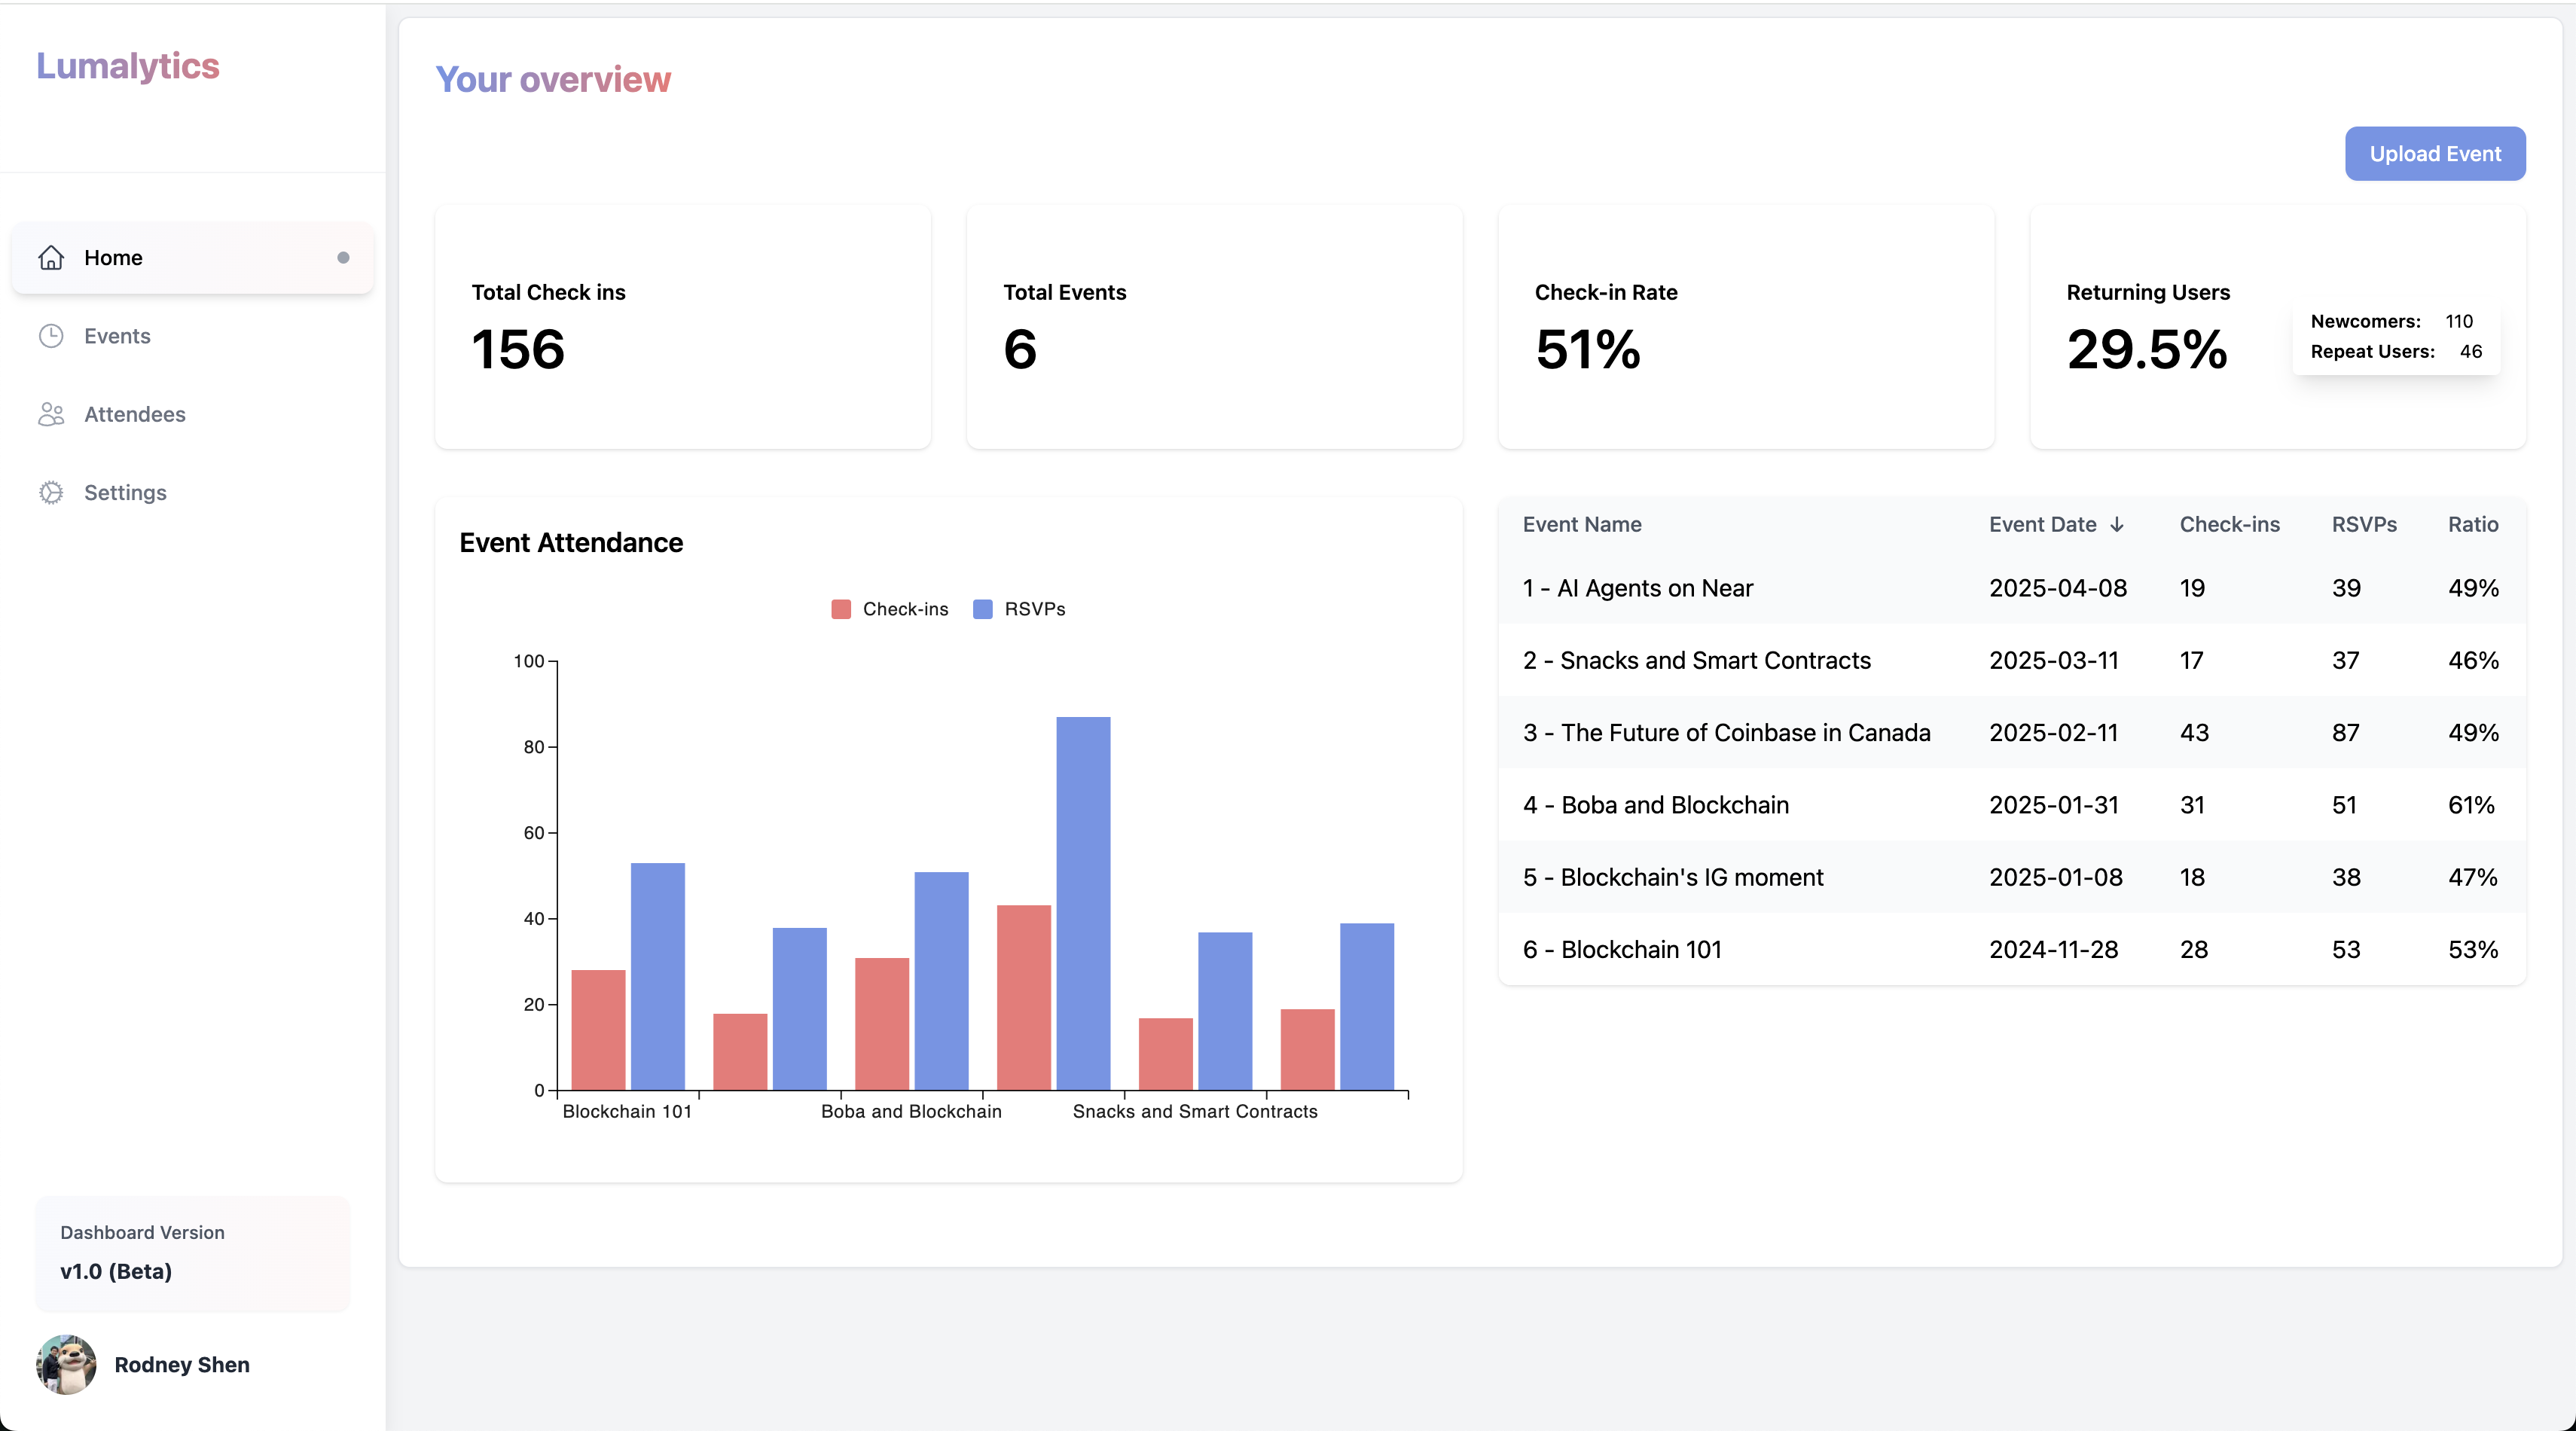
Once you successfully uploaded all your events, you will be redirected to the dashboard.
### This is what mine looks like:
 ## Sections:
There are 2 sections on the dashboard:
* **General Stats**:
* **Graphs**:
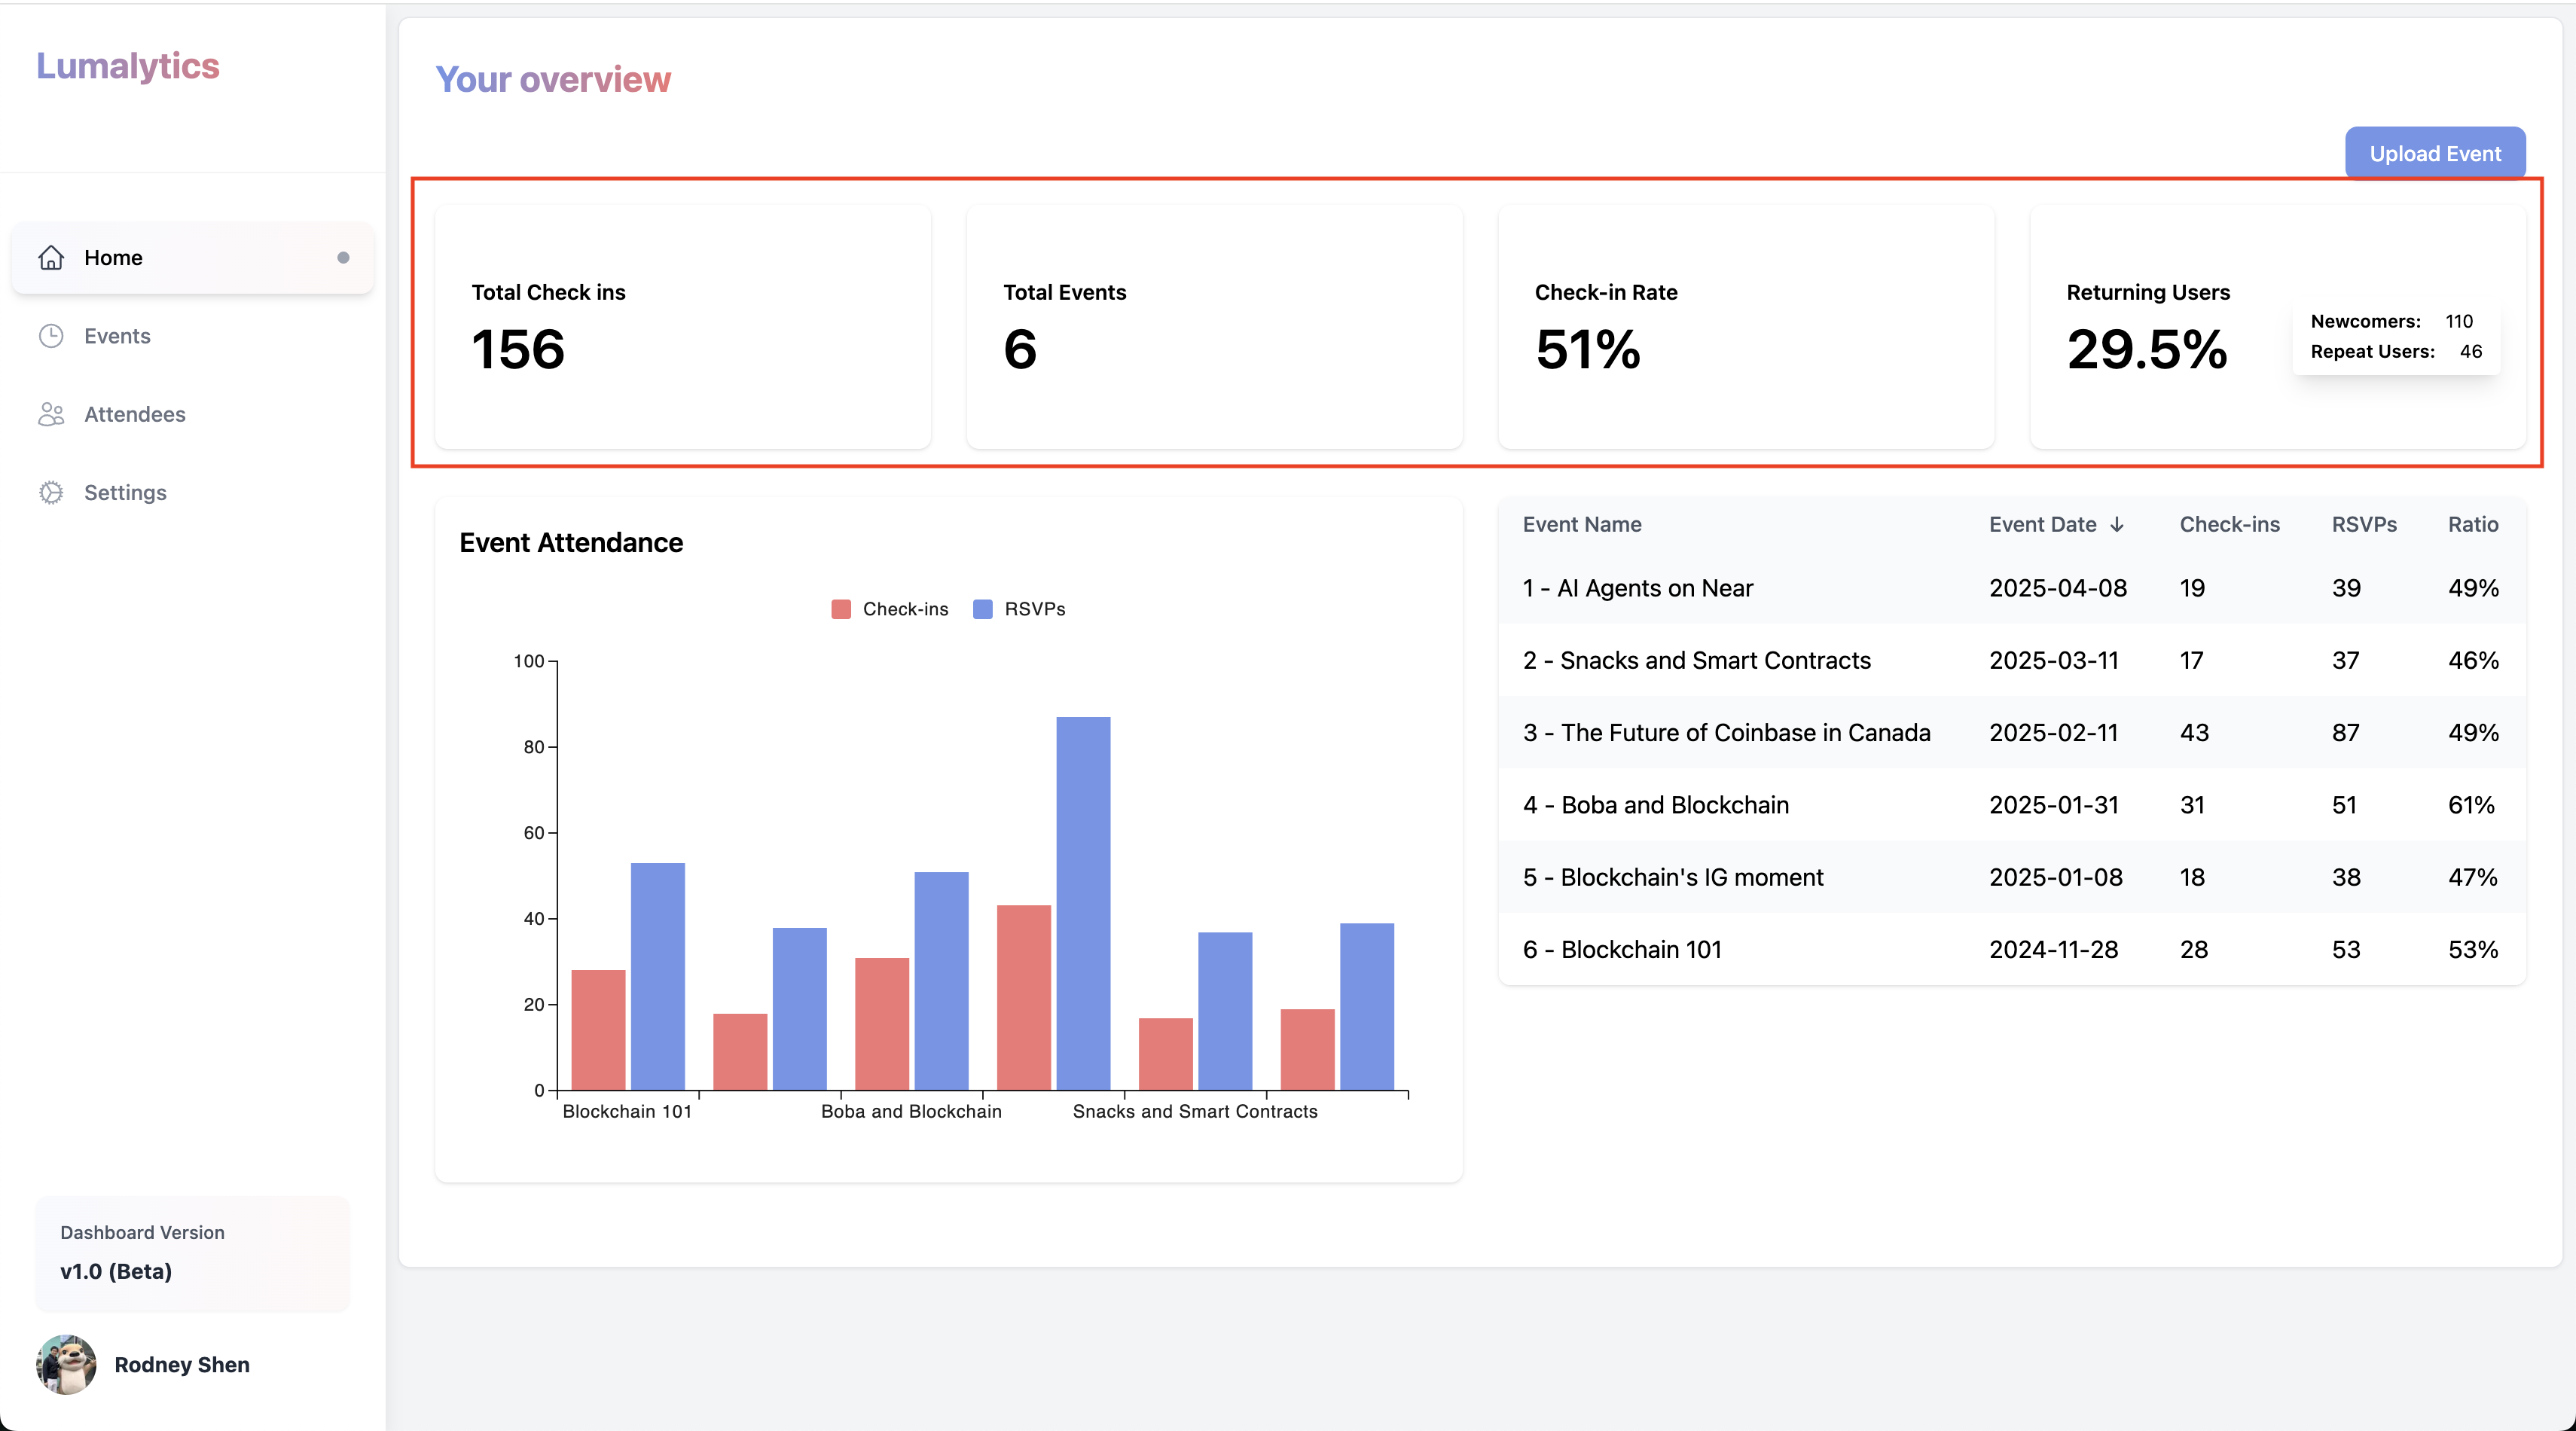
### General Stats:
These track key KPIs for your events.
They can all be hovered
## Sections:
There are 2 sections on the dashboard:
* **General Stats**:
* **Graphs**:
### General Stats:
These track key KPIs for your events.
They can all be hovered
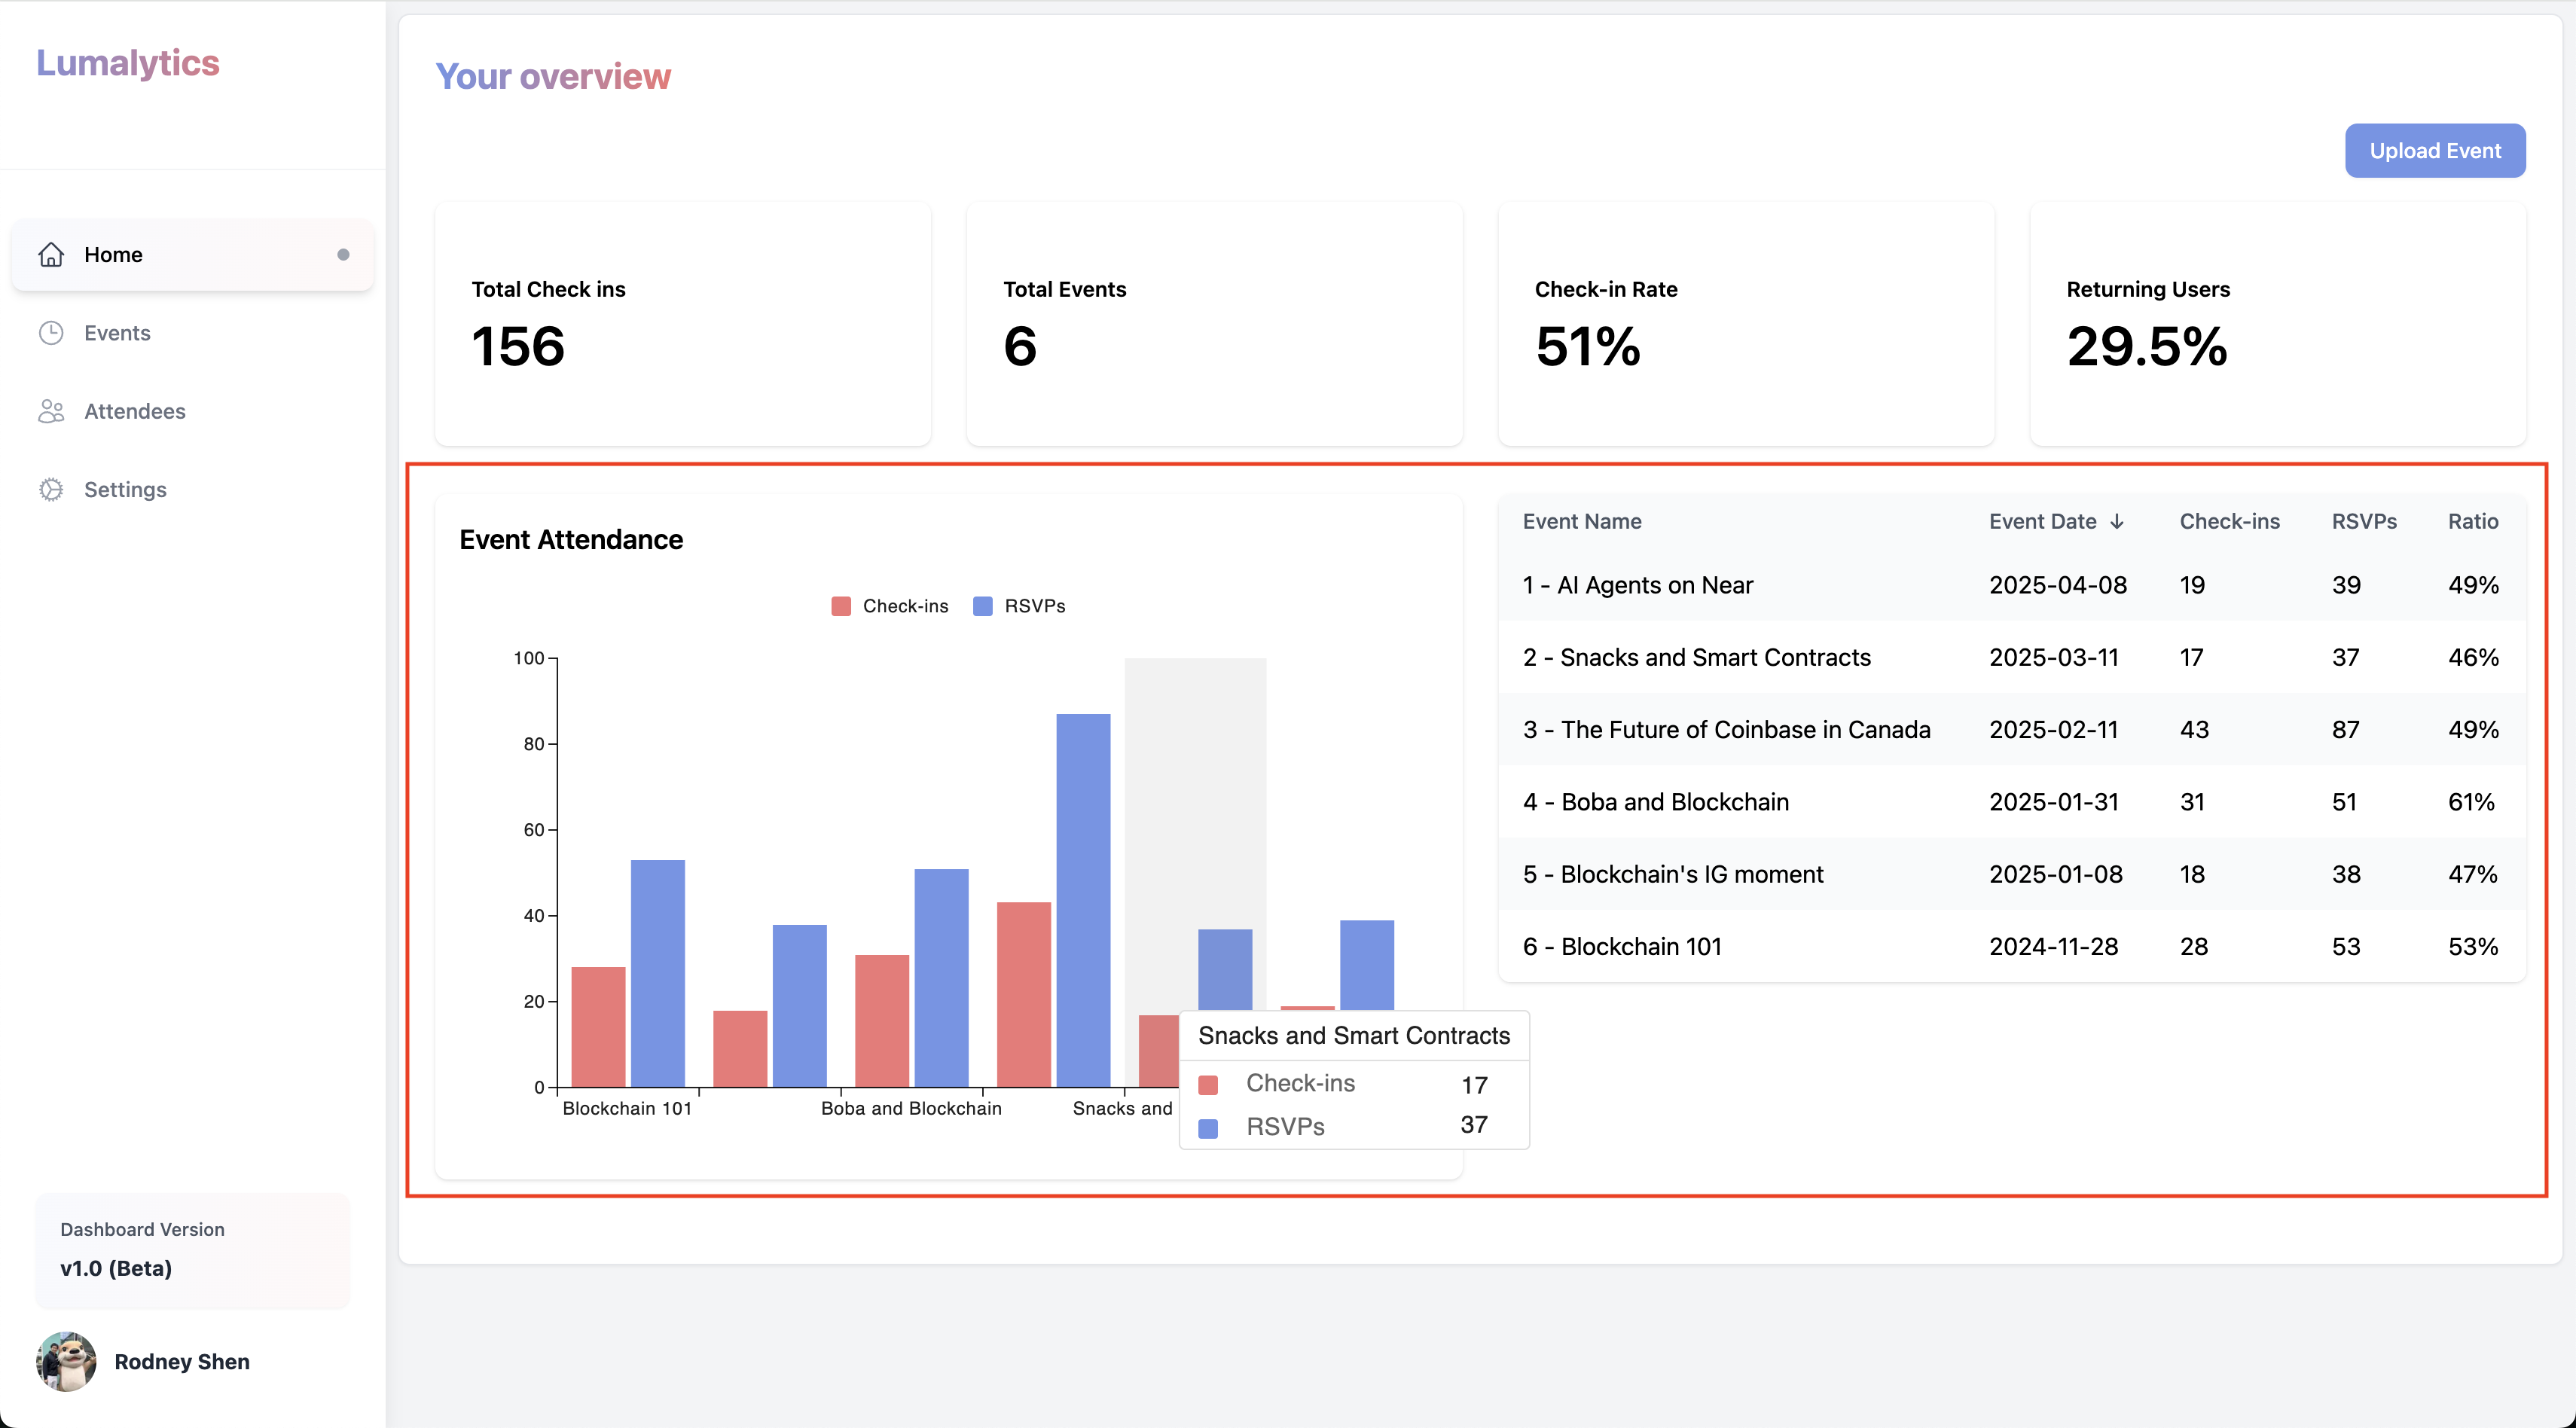
 ## Graphs:
These allow you visualize the data in a more digestable way.
The bar chart can hovered - The table can be sorted based off all the header components
## Graphs:
These allow you visualize the data in a more digestable way.
The bar chart can hovered - The table can be sorted based off all the header components