> ## Documentation Index
> Fetch the complete documentation index at: https://docs.lumalytics.app/llms.txt
> Use this file to discover all available pages before exploring further.
# Events
> Overview of your events.
## Overview
Next is the events sections. Here you will generalized data of you events as well as individual event stats.
This is what mine looks like:
### 1. Header Graphs
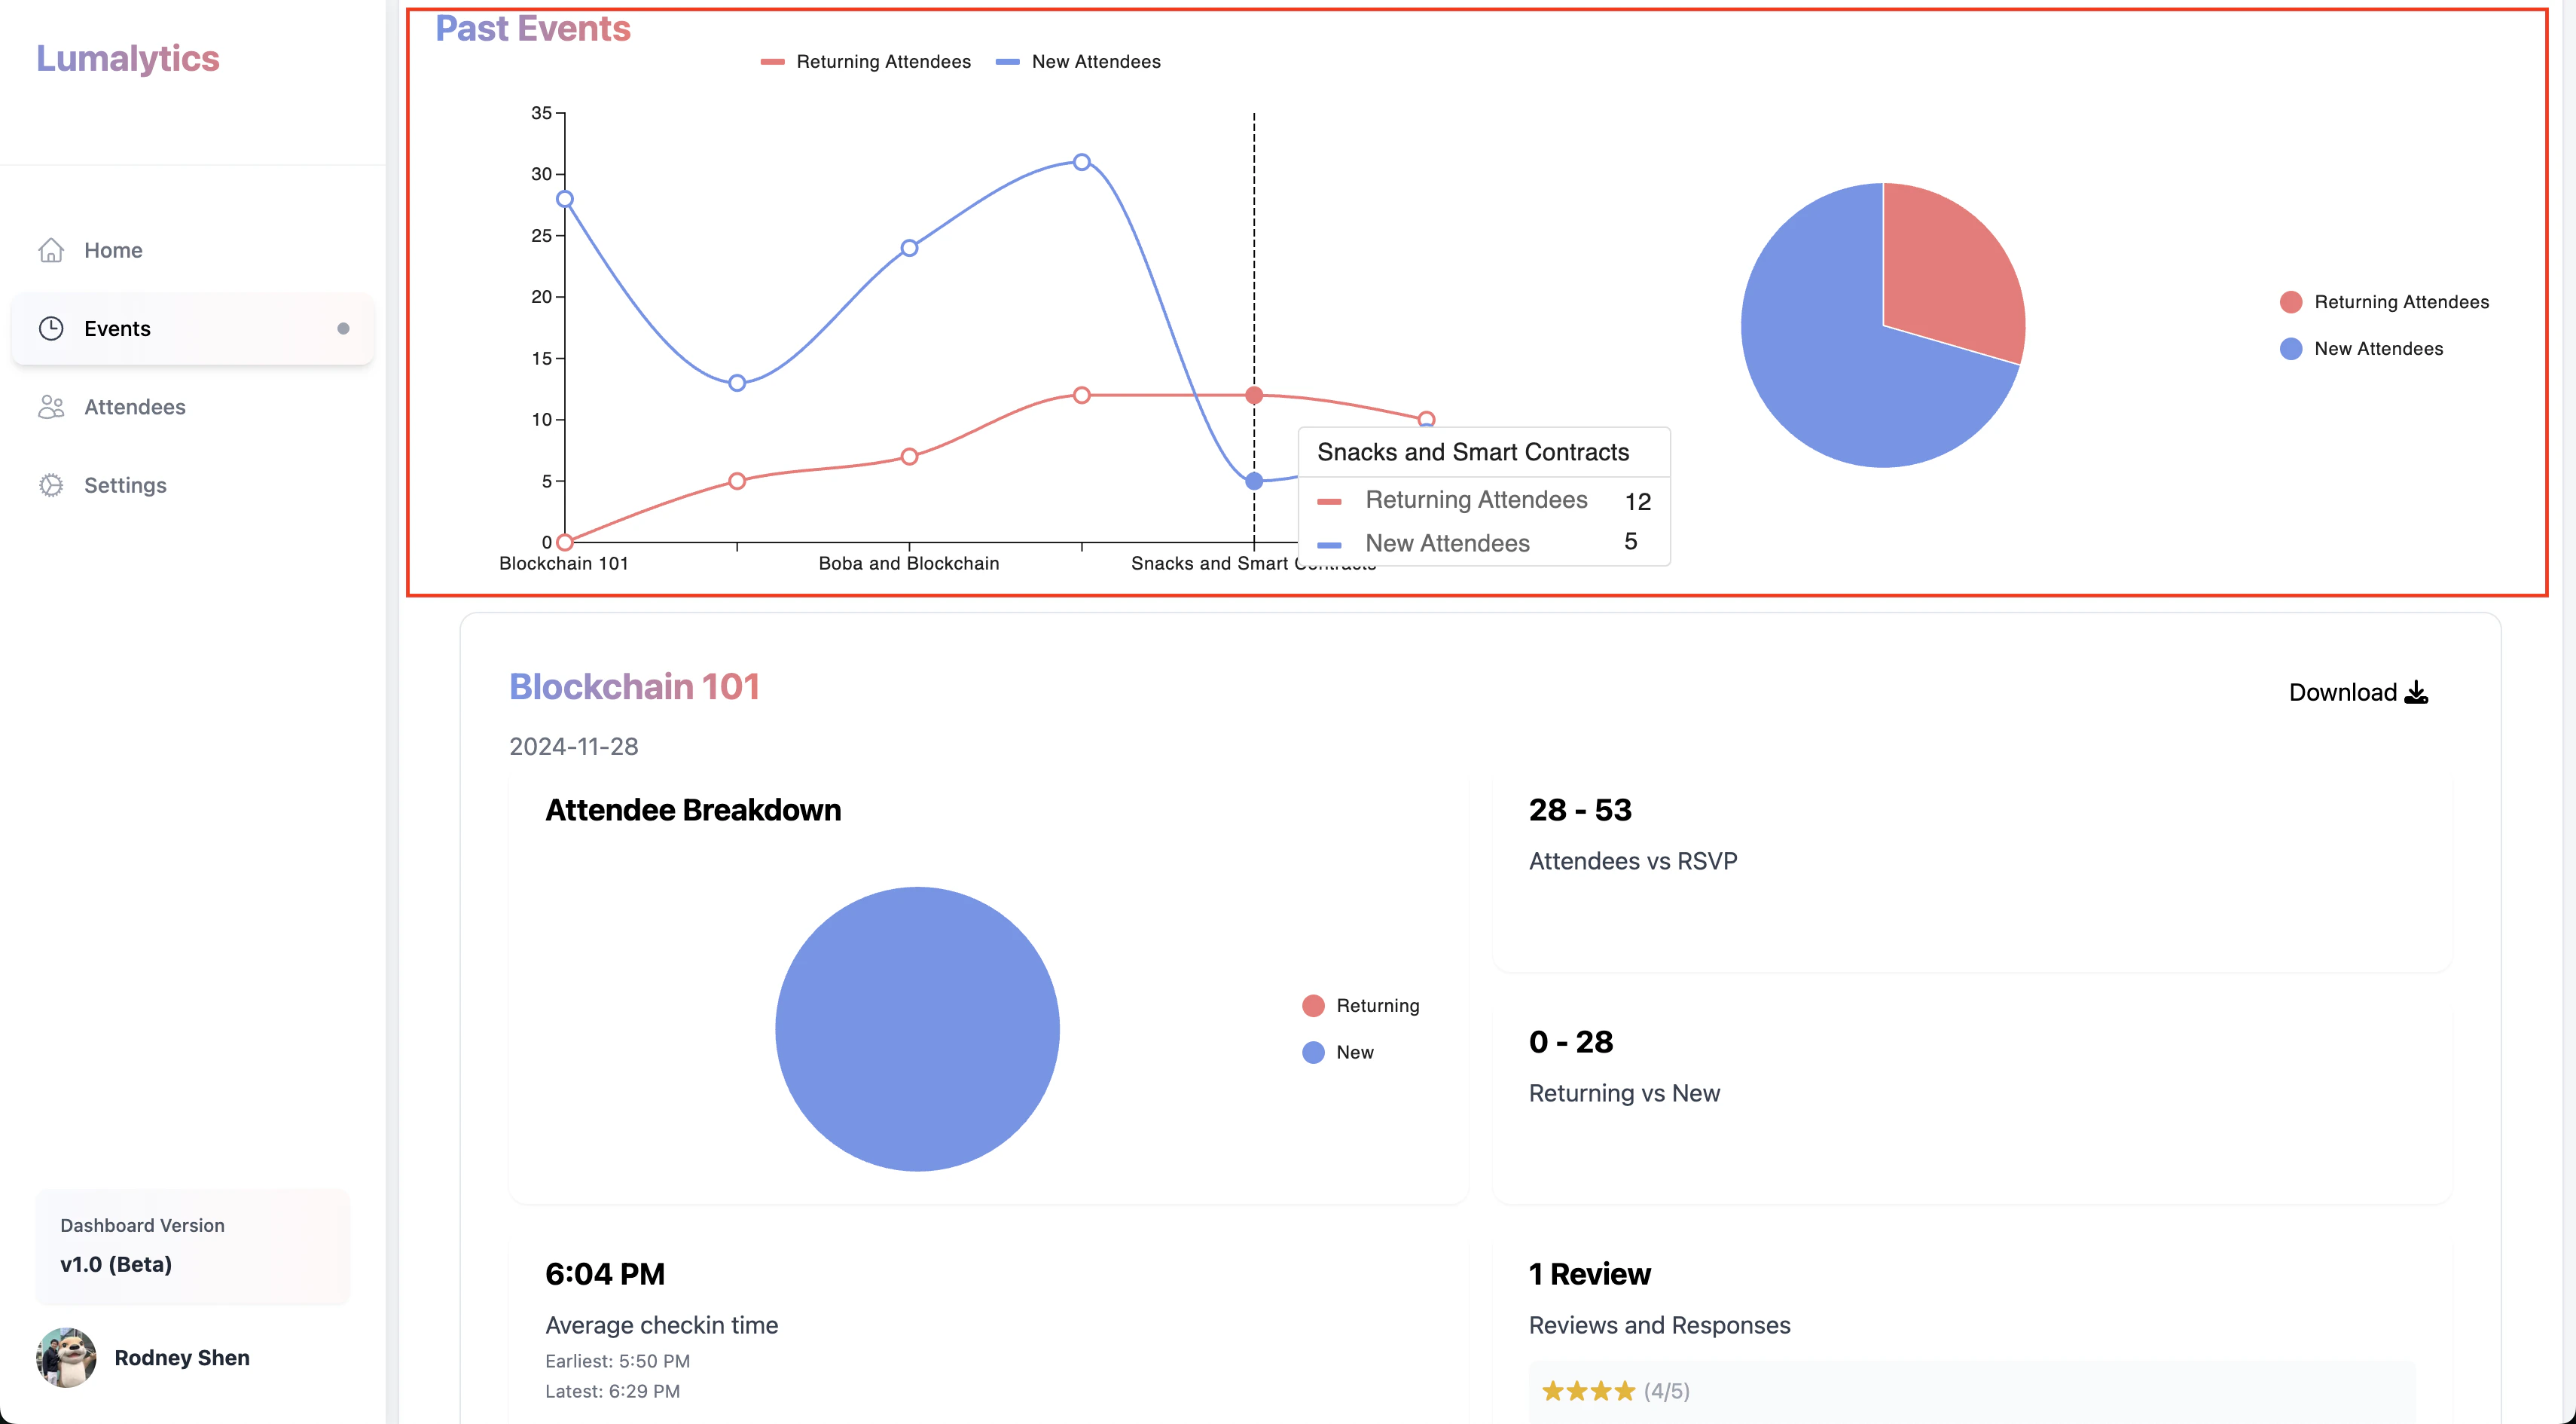
The very top section is all about returning attendees. This is a strong indicator and allows Luma hosts to guage if they are building a loyal group.
Both charts can be hovered to visualize the breakdown
 ### 2.Individual Event Stats:
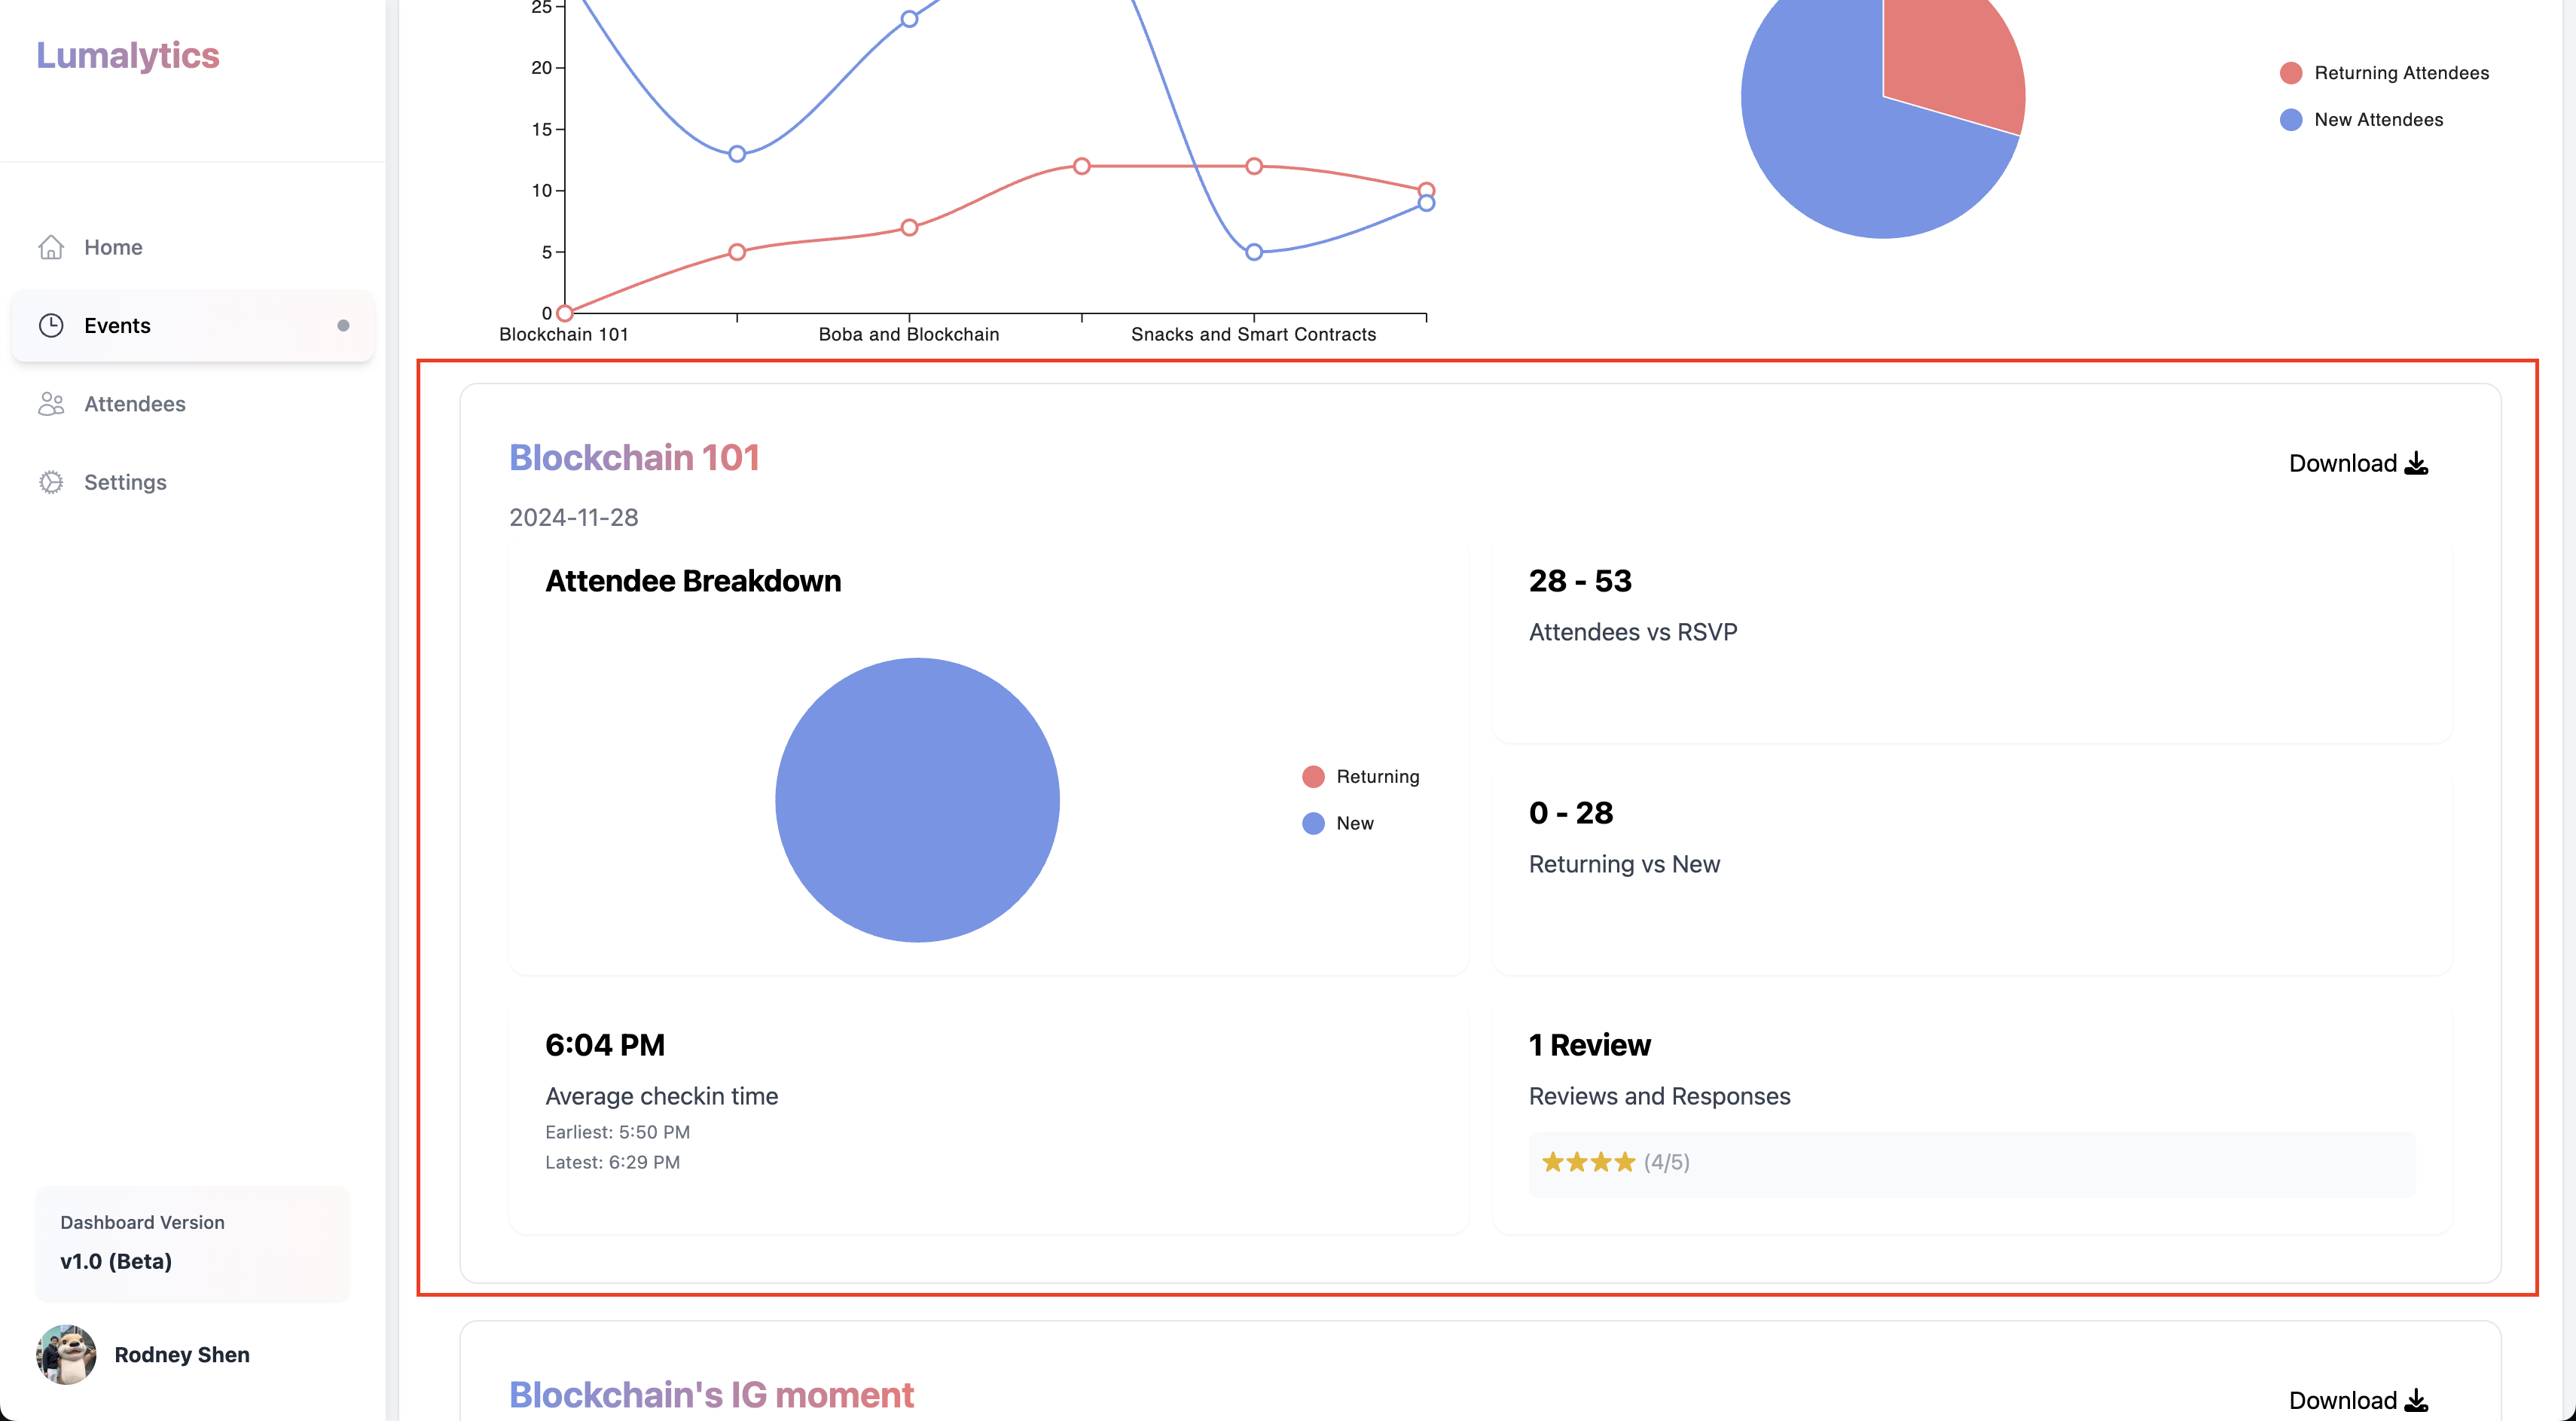
This section provides a more in-depth look at an individual event.
Tracking basic stats such as:
* Attendees vs RSVP
* New vs Returning
* Average Check-in time
* Reviews & Responses
### 2.Individual Event Stats:
This section provides a more in-depth look at an individual event.
Tracking basic stats such as:
* Attendees vs RSVP
* New vs Returning
* Average Check-in time
* Reviews & Responses