Overview
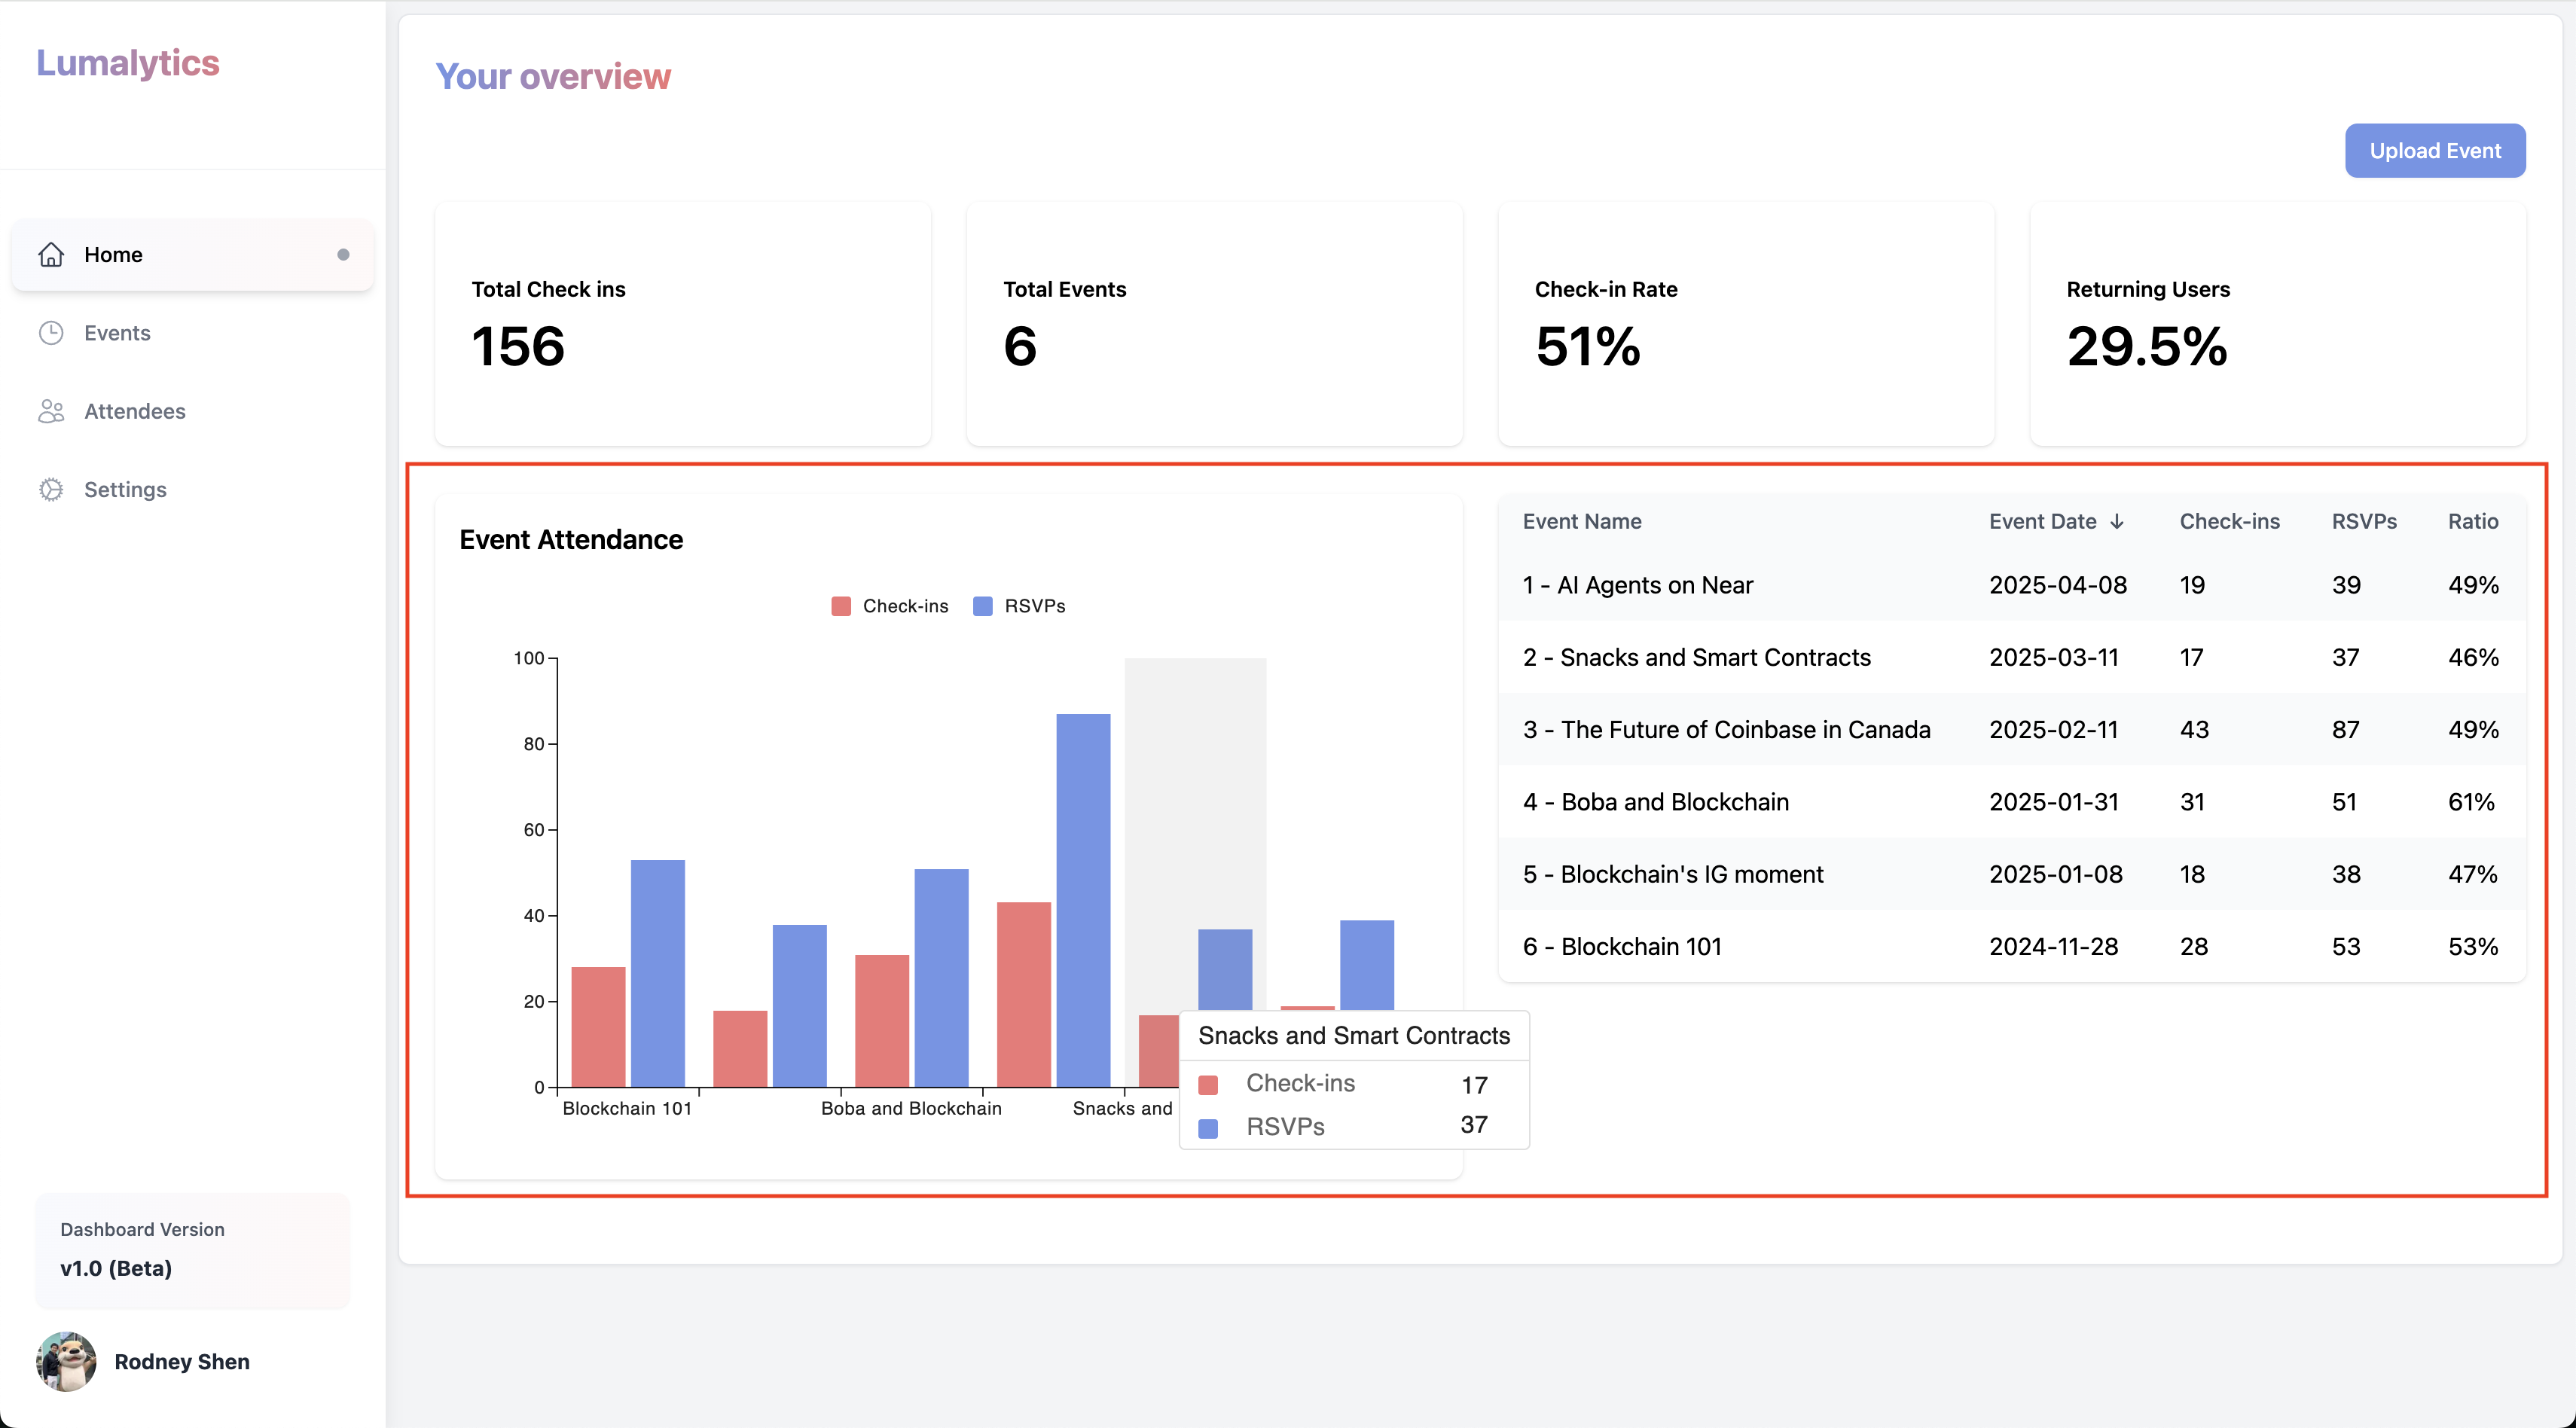
Once you successfully uploaded all your events, you will be redirected to the dashboard.This is what mine looks like:
Sections:
There are 2 sections on the dashboard:- General Stats:
- Graphs:
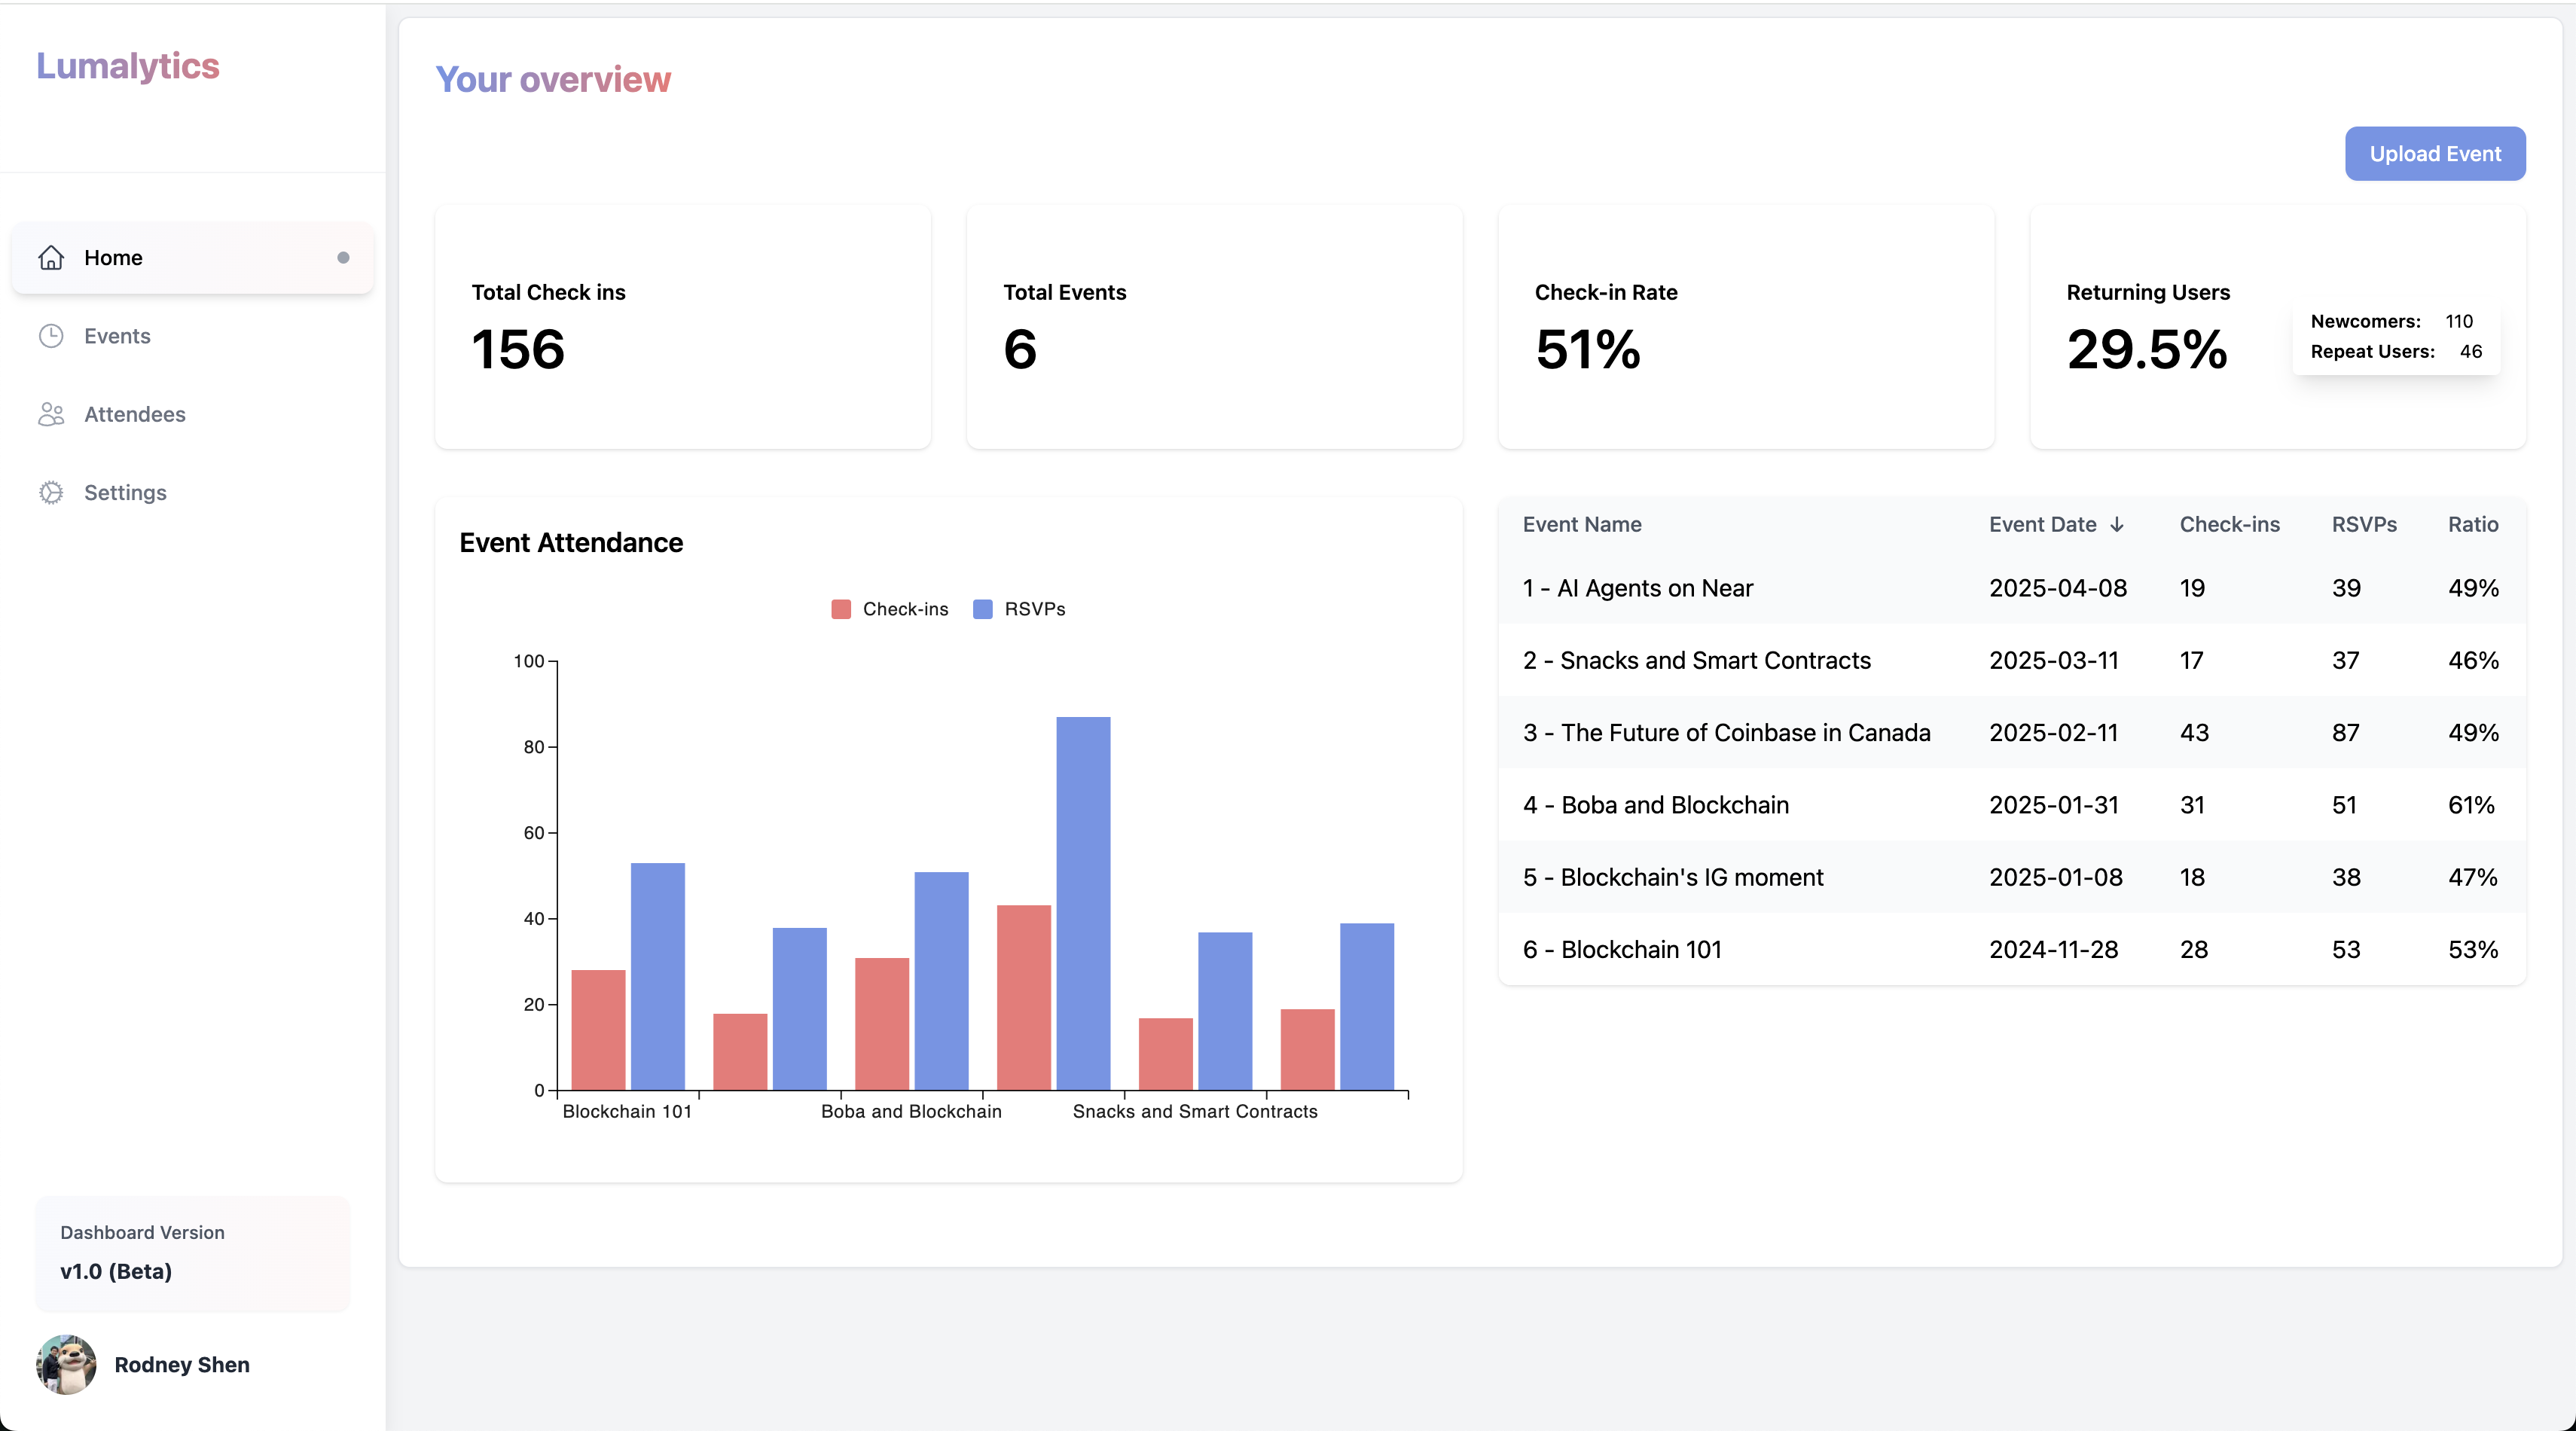
General Stats:
These track key KPIs for your events.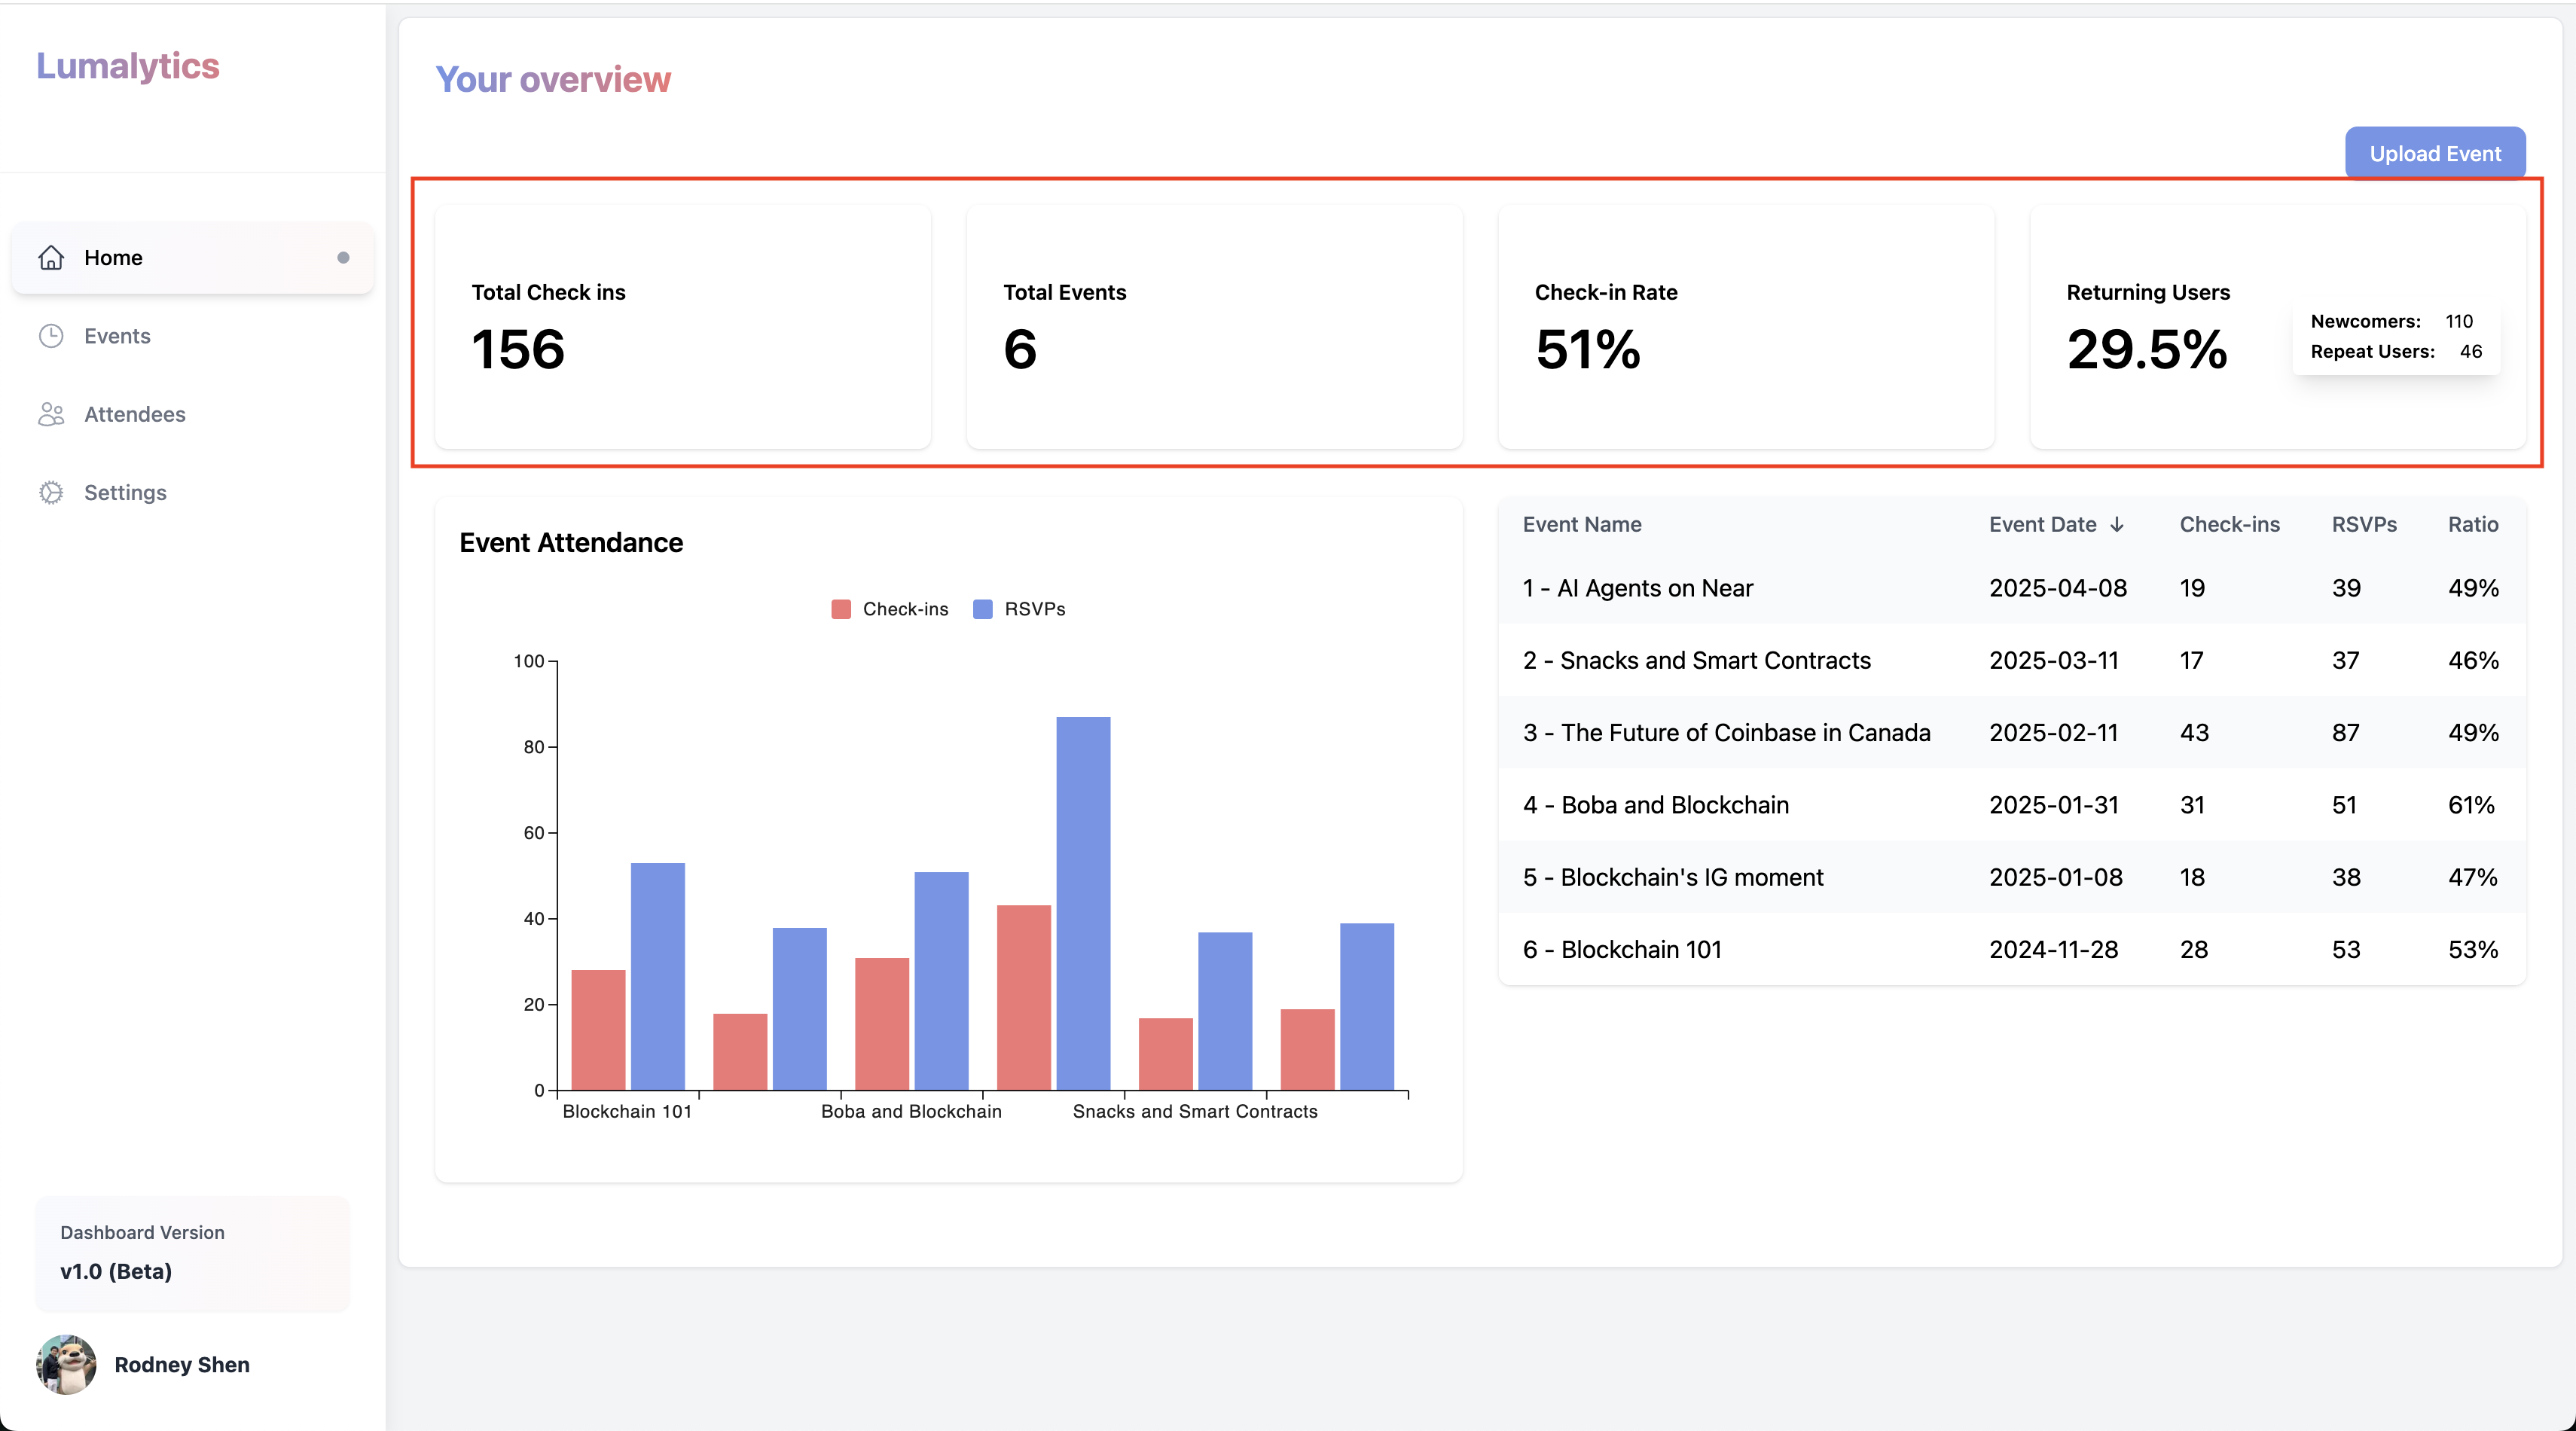
Graphs:
These allow you visualize the data in a more digestable way.